The Value of Global Climate Regulation Services of the World’s Biomes
Panagiotis Tsigaris
Introduction
In this short commentary, we explore the value of the global climate regulation services within the Ecosystem Services Valuation Database (ESVD) across marine and terrestrial biomes (Brander et al., 2023). The aim is to place a value on the biomes service of global climate regulation. The assessment can aid in determining the best nature-based solution to the climate change crises (Griscom et al., 2017). Biomes contribute to stabilizing and regulating Earth’s climate, including the sequestration and storage of greenhouse gases by forests, wetlands, grasslands, and oceans. The latter role is absorbing CO2 and heat, although it results in acidification, destroying marine life. Ice sheets and polar alpine biomes also play a significant role by reflecting sunlight and keeping the Earth’s temperature cooler than it would be without these biomes.
Valuation of Global Climate Regulation Services

The surface area of the biomes was measured using data from published research to place a monetary value on global climate regulation. The ESVD provides data on the value of global climate regulation services per hectare (ha) per year of the biomes (Brander et al., 2023). Initially, all 9,500 observations were extracted, 546 of which had “climate regulation” as ecosystem services 1 (ES_1) from the Economics of Ecosystems and Biodiversity (TEEB) and the “global climate regulation services” from the Ecosystem Accounting (SEEA). Of the 546 observations, 350 had only one primary ESVD2.0 biome, and the other biomes were removed due to their joint contribution. Table 1 provides summary statistics after sorting the 350 observations according to ES_1.
The open sea is the largest biome, estimated at 33.07 billion ha, followed by rangelands, natural grasslands, and savannas, representing 3.50 billion ha. Forests have a surface area of 4.2 billion ha but are divided into two forest biomes. Although urban and industrial areas occupy the most minor surface on Earth, they release the most GHG emissions.
Biome Values
The highest global climate regulation services valuation arises from the rangelands, natural grasslands, and savannas (RGS), with an average price/ha/year at Int$24,613. The second valued biome for climate regulation is coastal systems at Int$15,982/ha/year. The median values are lower, showing the influence of high valuations pulling the average much higher. The highest valuation with a median is the urban and industrial areas, followed by the polar alpine and RGS biomes. The degradation of the alpine biome impacts the Earth’s albedo, or its capacity to reflect the Sun’s rays, which in turn increases global temperatures, exaggerating climate change. Most likely, valuation increases over time due to a reduced supply of services arising from the degradation of the biomes. Furthermore, demand for such services may have increased over time due to increased living standards. Hence, people value ecosystem services more as they degrade.

Rangelands, Natural Grasslands, & Savannas
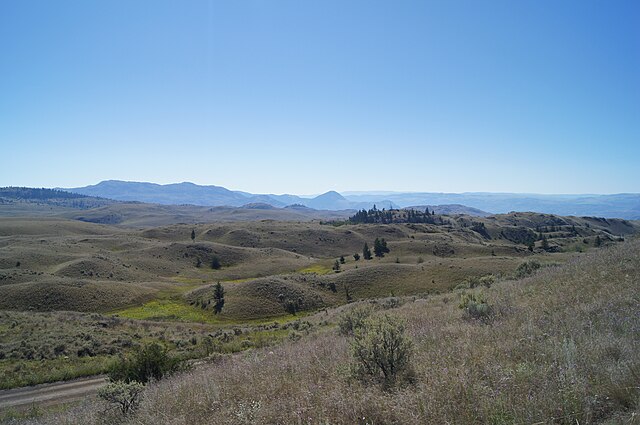
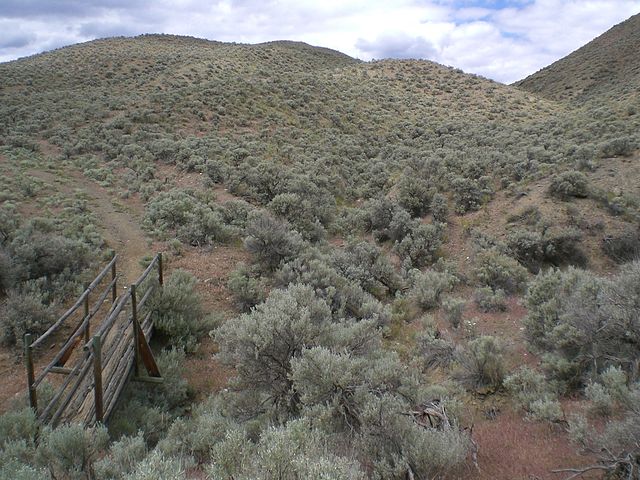
RGS is crucial for carbon sequestration and the global carbon cycle (Conant, 2012; Lorenz & Lal, 2018; Bai & Cotrufo, 2022). About a third of terrestrial carbon is stored in grasslands (Bai & Cotrufo, 2022). This study indicates a high valuation of RGS ecosystem services for global climate regulation relative to the other biomes. Grasslands store 343 Pg of soil organic carbon to 1 m deep and 0.5 Pg C/year in sequestration (Lorenz & Lal, 2018; Sha et al., 2022). This storage and sequestration translate to USD 214 trillion in nature’s savings account and adds USD 312 billion annually into the savings account, assuming a price of CO2e at 170 a ton. Bai & Cotrufo (2022) suggests that improving grazing management and biodiversity restoration can achieve a low-cost, high-carbon gain in grasslands worldwide. This study finds the importance of RGS in global climate regulation services and challenges us to rethink their use and maintenance.
Table 1: Global Climate Regulation Services
| Skip Table 1 | |||||||||
| ESVD2.0_ Biome (No interaction) | Area (e9 ha) |
Average (Int$/ha/year) | Median (Int$/ha/year) | # of Values | Std Error | Min | Max | Average Value per year (e12 in Int$) | Median Value per year (e12 in Int$) |
|---|---|---|---|---|---|---|---|---|---|
| Earth | 51.00 | — | — | — | — | — | — | — | — |
| Marine | 36.17 | — | — | — | — | — | — | — | — |
| Marine – Coastal Systems | 3.10 | 15,982 | 149 | 64 | 13,767 | 3.34 | 880,239 | 49.5 | 0.46 |
| Marine – Open Sea | 33.07 | 93 | 73 | 16 | 32 | 0.03 | 484 | 3.1 | 2.40 |
| Global Terrestrial Surface | 14.83 | — | — | — | — | — | — | — | — |
| Rangelands, Natural Grasslands, and Savannas | 3.50 | 24,613 | 473 | 23 | 13,321 | 0.13 | 258,256 | 85.7 | 1.65 |
| Intensive Land Use (Croplands) | 0.16 | 7,625 | 84 | 91 | 7,454 | 0.02 | 678,475 | 12.7 | 0.14 |
| Temperate and Boreal Forests and woodlands | 2.48 | 5,460 | 230 | 56 | 2,370 | 2.20 | 78,186 | 12.4 | 0.52 |
| Tropical Forests | 1.73 | 712 | 288 | 44 | 169 | 0.07 | 5,533 | 1.2 | 0.50 |
| Urban and Industrial Areas | 0.10 | 1,455 | 852 | 15 | 650 | 15.67 | 10,371 | 0.1 | 0.09 |
| Inland Wetlands | 1.29 | 1,136 | 256 | 23 | 479 | 4.97 | 9,420 | 1.4 | 0.31 |
| Polar – Alpine | 0.36 | 671 | 809 | 5 | 285 | 1.73 | 1,314 | 0.9 | 1.13 |
| Rivers and Lakes | 0.55 | 355 | 329 | 4 | 195 | 4.27 | 758 | 0.1 | 0.13 |
| Tundra | 1.16 | — | — | — | — | — | — | — | — |
| Antarctica, Greenland Ice sheets | 1.57 | — | — | — | — | — | — | — | — |
| Deserts – Barren Land (19% of Terrestrial) | 2.82 | — | — | — | — | — | — | — | — |
| Statistical Error | 0.27 | — | — | — | — | — | — | — | — |
Note. Surface area of earth, water and land were obtained from Nations Online Project (n.d.). Rangelands, natural grasslands and savannas including shrublands from the International Livestock Research Institute (2021). Tropical forests from Poker & MacDicken (2016). Total forest area from Food and Agriculture Organization (FAO) of the United Nations (2019). Temperate, boreal and woodlands is estimated at 2.478 billion ha, from the United Nations Economic Commission for Europe (2000). Surface area of lakes greater than 0.001 ha was 0.476 billion ha obtained from Verpoorter et al. (2014). Allen and Pavelsky (2018) estimated rivers and streams at 0.0773 billion ha. Intensive land use from Tubiello et al. (2021). Urban and industrial area from Gao & O’Neil (2020). Inland wetlands from Davidson et al. (2023). Polar-Alpine from Testolin et al. (2020). Tundra and Deserts – Barren land from International Livestock Research Institute (2021). Tundra and Desserts from International Livestock Research Institute (2023) and United Nations (n.d.). Antarctic and Greenland ice sheets obtained from National Snow and Ice Data Center (n.d.). The statistical error of 0.27 billion ha reflects some double counting and statistical errors.

Media Attributions
Figure 1: “LacDuBoisBC.JPG” by Straitgate (2011b), via Wikimedia Commons, is used under a CC BY-SA 3.0 license.
Figure 2: “Grassland” by Ghune (2010), via Wikimedia Commons, is used under a CC0 1.0 Universal Public Domain license.
Figure 3: “LacDuBois Pano BC” by Straitgate (2011a), via Wikimedia Commons, is used under a CC BY-SA 3.0 license.
References
Allen, G. H., & Pavelsky, T. M. (2018). Global extent of rivers and streams. Science, 361(6402), 585–588. https://doi.org/10.1126/science.aat0636.
Bai, Y., & Cotrufo, M. F. (2022). Grassland soil carbon sequestration: Current understanding, challenges, and solutions. Science, 377(6606), 603–608. https://doi.org/10.1126/science.abo2380.
Bardgett, R.D., Bullock, J.M., Lavorel, S., Manning, P., Schaffner, U., Ostle, N., Chomel, M., Durigan, G., Fry, E. L., Johnson, D., Lavellee, J. M., Le Provost, G., Luo, S., Png, K., Sankaran, M., Hou, X., Zhou, H., Ma, L., Rem, W., … Shi, H. (2021) Combatting global grassland degradation. Nature Reviews Earth & Environment, 2, 720–735 https://doi.org/10.1038/s43017-021-00207-2.
Brander, L. M., de Groot, R., Guisado Goñi, V., van ‘t Hoff, V., Schägner, P., Solomonides, S., McVittie, A., Eppink, F., Sposato, M., Do, L., Ghermandi, A., and Sinclair, M., Thomas, R., (2023). Ecosystem services valuation database (ESVD). Foundation for Sustainable Development and Brander Environmental Economics. https://www.esvd.net/
Conant, R. T. (2012). Grassland soil organic carbon stocks: Status, opportunities, vulnerability. In R. Lal, K. Lorenz, R. F. Hüttl, B. U. Schneider, & J. von Braun (Eds.), Recarbonization of the biosphere. Springer Dordrecht. https://doi.org/10.1007/978-94-007-4159-1_13.
Davidson, N. C., Finlayson, C. M., & Fluet-Chouinard, E. (2023). 4 – The extent and distribution of the world’s wetlands. In P. A. Gell, N. C. Davidson, & C. M. Finlayson (Eds.), Ramsar wetlands. (pp. 91–114). https://doi.org/10.1016/B978-0-12-817803-4.00006-1.
Dinerstein, E., Olson, D., Joshi, A., Vynne, C., Burgess, N. D., Wikramanayake, E., Hahn, N., Palminteri, S., Hedao, P., Noss, R., Hansen, M., Locke, H., Ellis, E. C., Jones, B., Barber, C. V., Hayes, R., Kormos, C., Martin, V., Crist. E., … Saleem, M. (2017). An ecoregion-based approach to protecting half the terrestrial realm. BioScience, 67(6), 534–545. https://doi.org/10.1093/biosci/bix014.
Food and Agriculture Organization of the United Nations, & United Nations Environment Programme. (2019). The state of the world’s forests 2020 [Interactive story]. http://www.fao.org/state-of-forests/en/.
Gao, J., & O’Neill, B. C. (2020). Mapping global urban land for the 21st century with data-driven simulations and shared socioeconomic pathways. Nature Communications, 11, Article 2302. https://doi.org/10.1038/s41467-020-15788-7.
Ghune. (2010). Grassland [Image]. Wikimedia Commons. https://commons.wikimedia.org/wiki/File:Grassland.jpg.
Griscom, B. W., Adams, J., Ellis, P. W., Houghton, R. A., Lomax, G., Miteva, D. A., Schlesinger, W. H., Shoch, D., Siikamäki, J. V., Smith, P., Woodbury, P., Zganjar, C., Blackman, A., Campari, J., Conant, R. T., Delgado, C., Elias, P., Gopalakirshna, T., Hamsik, M. R., … Fargione, J. (2017). Natural climate solutions. Proceedings of the National Academy of Sciences, 114(44), 11645–11650. https://doi.org/10.1073/pnas.1710465114.
International Livestock Research Institute. (2021). Rangelands atlas. https://www.rangelandsdata.org/atlas/.
Lorenz, K., & Lal, R. (2018). Carbon sequestration in grasslands soils. In Carbon sequestration in agricultural ecosystems. Springer, Cham. https://doi.org/10.1007/978-3-319-92318-5_4.
Nations Online Project. (n.d.). The Earth. https://www.nationsonline.org/oneworld/earth.htm.
National Snow and Ice Data Center. (n.d.). Quick facts. https://nsidc.org/learn/parts-cryosphere/ice-sheets/ice-sheet-quick-facts.
Poker, J., & MacDicken, K. (2016). Tropical forest resources: Facts and tables. In L. Pancel, & M. Köhl, Tropical forestry handbook. Springer Berlin, Heidelberg. https://doi.org/10.1007/978-3-642-54601-3_7.
Sha, Z., Bai, Y., Li, R., Lan, H., Zhang, X., Li, J., Liu, X., Chang, S., & Zie, Y. (2022). The global carbon sink potential of terrestrial vegetation can be increased substantially by optimal land management. Communications Earth & Environment, 3, Article 8. https://doi.org/10.1038/s43247-021-00333-1.
Straitgate. (2011a). LacDuBois pano BC [Image]. Wikimedia Commons. https://commons.wikimedia.org/wiki/File:LacDuBois_Pano_BC.JPG.
Straitgate. (2011b). LacDuBoisBC [Image]. Wikimedia Commons. https://commons.wikimedia.org/wiki/File:LacDuBoisBC.JPG.
Testolin, R., Attorre, F., & Jiménez‐Alfaro, B. (2020). Global distribution and bioclimatic characterization of alpine biomes. Ecography, 43(6), 779–788. https://doi.org/10.1111/ecog.05012.
Tubiello, F. N., Conchedda, G., de Santis, G., & Wanner, N. (2021). Land use statistics and indicators: Global, regional and country trends 1990–2019 (FAOSTAT Analytical Brief 28). Food and Agriculture Organization of the United Nations. https://openknowledge.fao.org/server/api/core/bitstreams/04f2740a-d8d2-40fa-8b08-4e0198e604b0/content.
United Nations. (n.d.). Why now? United Nations Decade For Deserts and the Fight Against Desertification. https://www.un.org/en/events/desertification_decade/whynow.shtml.
United Nations Economic Commission for Europe. (2000). Temperate and boreal forests resource assessment [Executive summary]. https://unece.org/DAM/timber/fra/screen/summary.pdf.
Verpoorter, C., Kutser, T., Seekell, D. A., & Tranvik, L. J. (2014). A global inventory of lakes based on high-resolution satellite imagery. Geophysical Research Letters, 41(18), 6396–6402. https://doi.org/10.1002/2014GL060641.

